Every tool requires training, and Tableau is just the same. Often companies invest in a data analytics tool like Tableau, believing in its value and the value of accessible data, but then don’t follow up their investment with the adequate amount of training to make the most of it. Tableau is just like any tool- if your users don’t know how to use it, and use it regularly, it won’t produce the results you were hoping for. The results are in the training.
Training is where users become pros at using Tableau and, more importantly, where they learn how to use data to inform their every-day decision making. Even employees that use data less often need to understand the fundamentals of how to see, understand, and apply data to their everyday decision making. Data literacy is crucial to your success as a company, and so often companies expect users that have no experience with data to start making extremely informed decisions just because Tableau is in reach. Effective training increases employees’ data literacy skills so that they are fully equipped to create and read the visualizations made possible by Tableau.
With hands-on training, users will learn that they don’t have to stumble around Tableau and hope they’re using it effectively- they’ll know exactly where to look for their data and how to manipulate it to best inform their decision-making. You’ll see employees at all levels start making more informed decisions on their own, and they’ll even be equipped to explore. With more eyes equipped to read your data, your company will be packed full with employees capable of coming up with unique, informed solutions to help you gain that competitive edge. All of this is possible with an effective training plan.
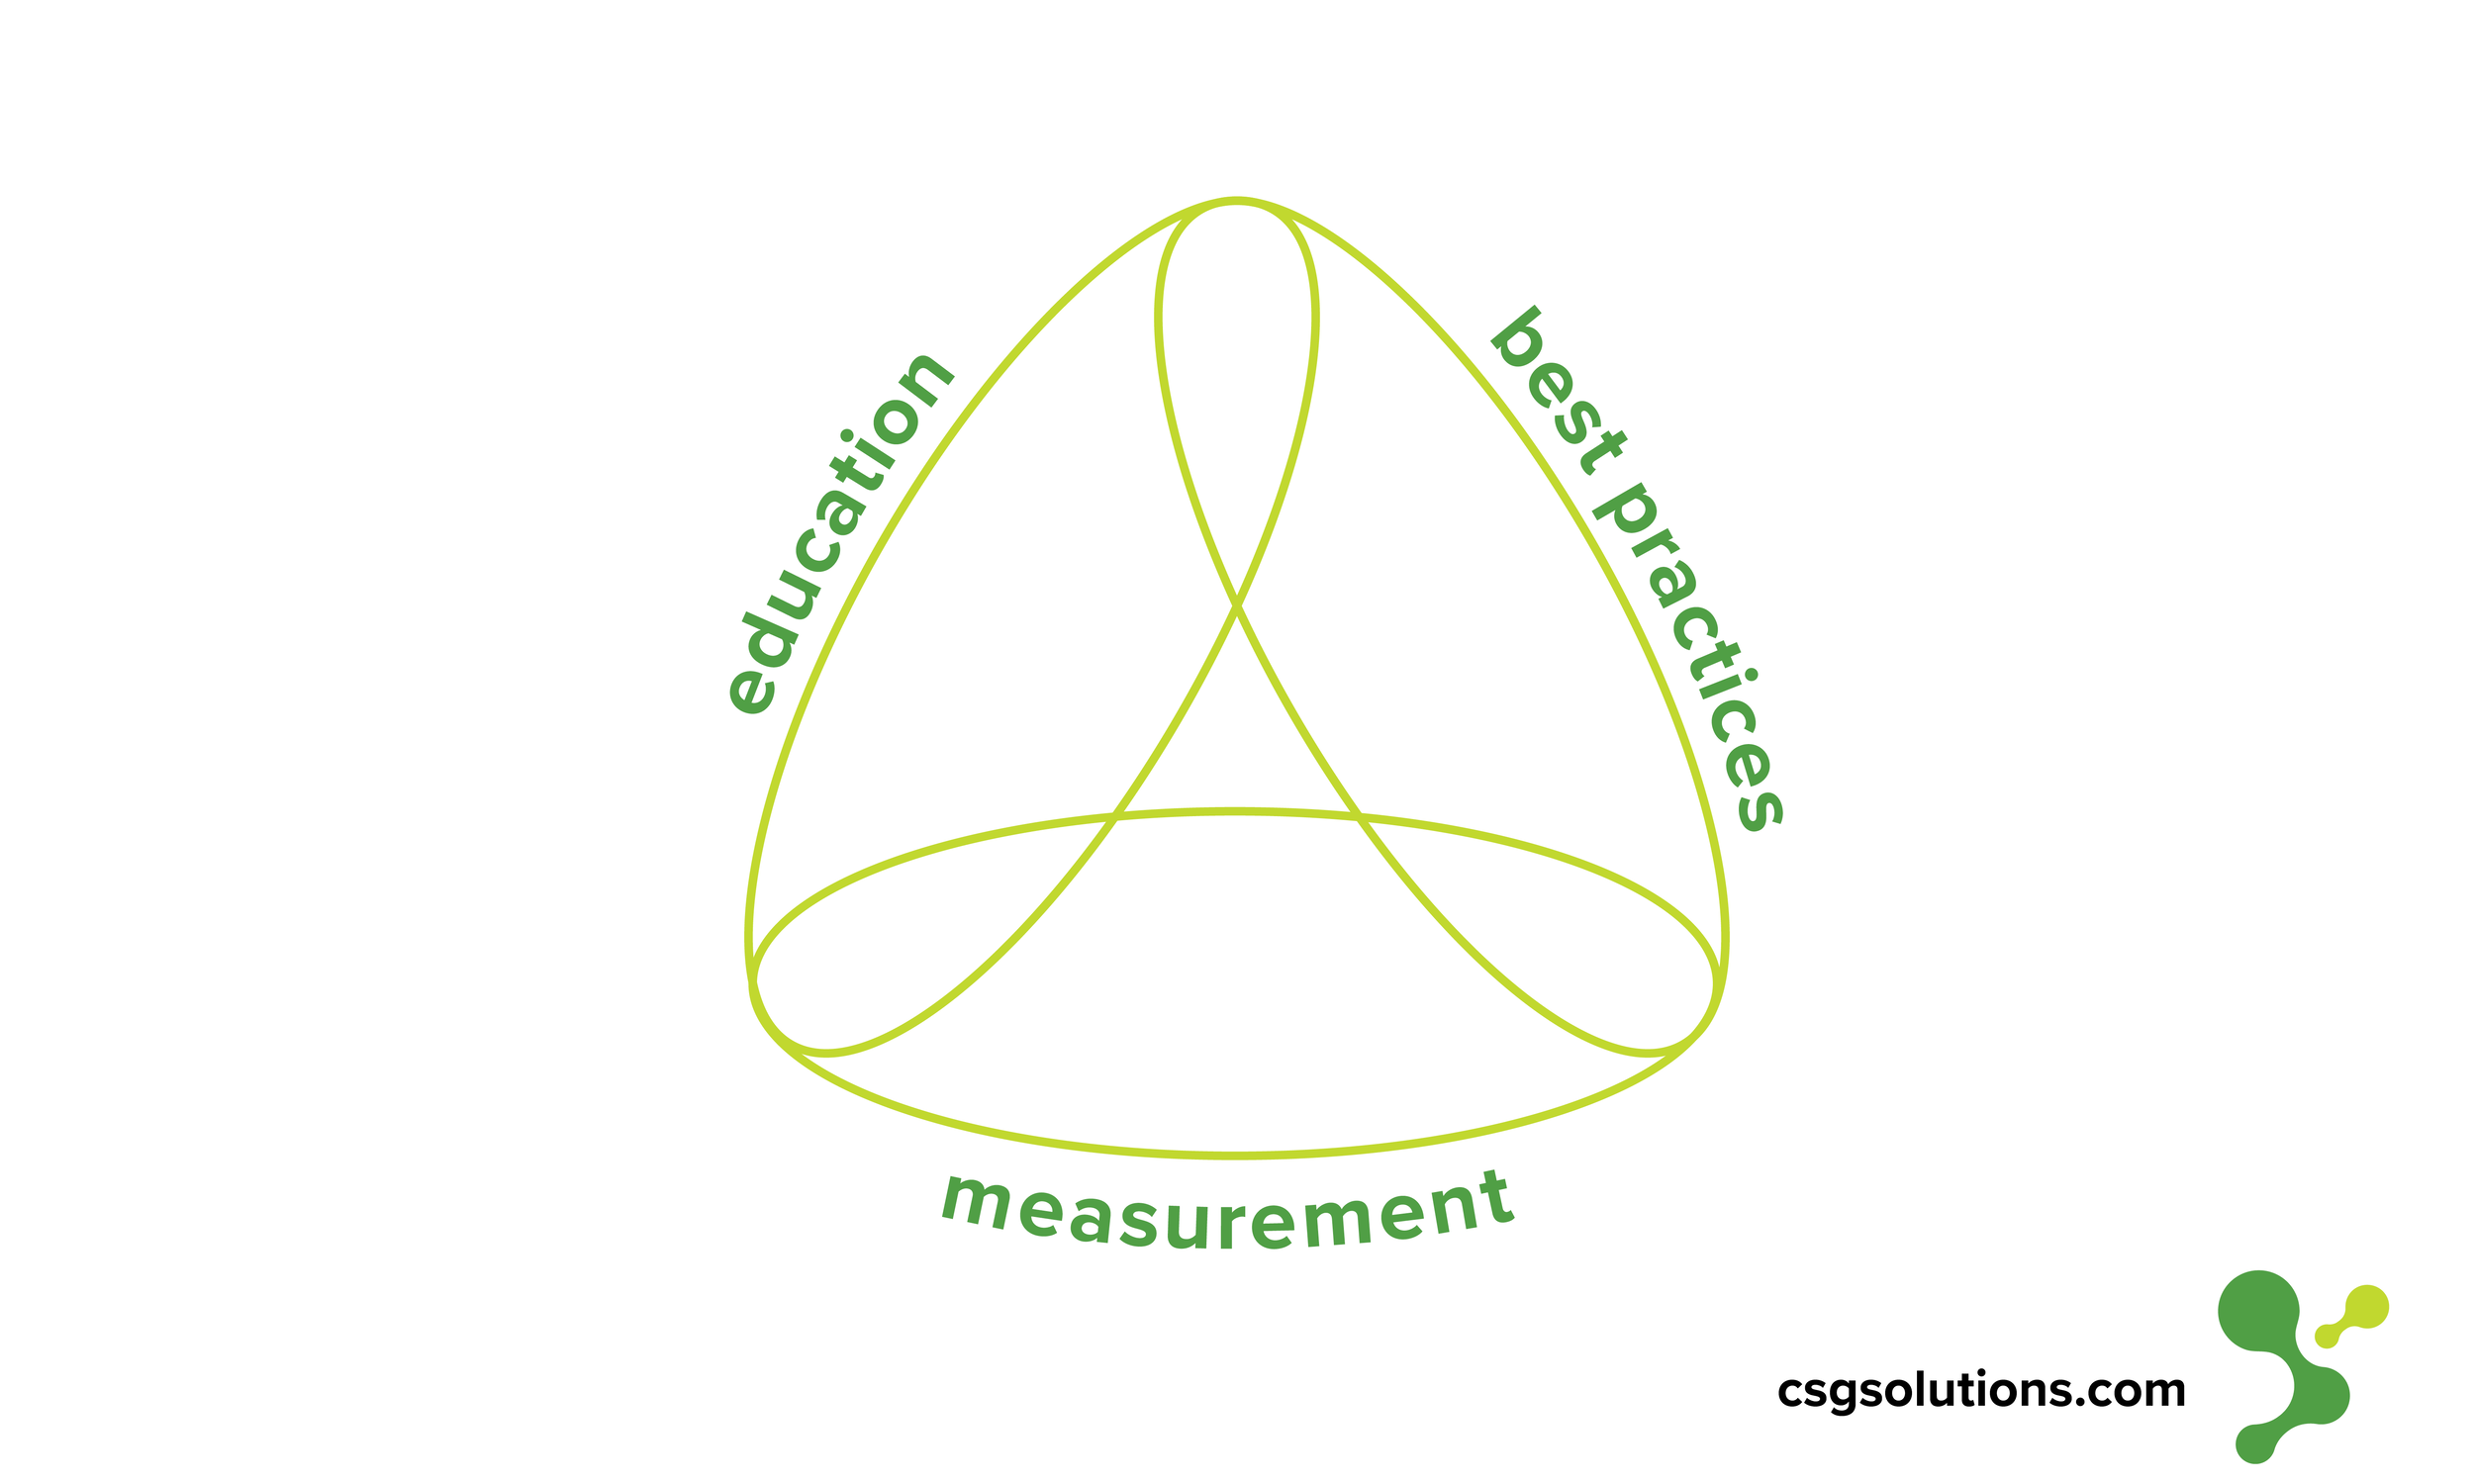
There are three necessary components to effectively using Tableau post-installation: education, measurement, and developing best practices. These steps will ensure that employees are using Tableau confidently, regularly, and in a way that supports your business and its larger goals for data.
Keep reading to dive deeper into the three components of promoting full adoption to maximize your investment:
Education
This is where your employees learn to use Tableau for basics and beyond. They learn how to navigate Tableau, how to make visualizations, read them, share them, and communicate their findings. Your education plan will equip them to realize the value of data, begin to unlock it for themselves, then rely on it regularly.
Here are a few fundamentals to developing an effective Tableau education plan for your employees:
Teaching should be tailored to your users’ specific job needs.
Every employee will use data differently. They’ll use different workbooks and need to manipulate visualizations differently. In the education stage, they should be set up to use Tableau for their specific needs.
At CSG, we love helping in this stage by leading training sessions for your employees where they get to work on their very own data. Instead of working on sample data that they’ll never look at again, we train your employees to use Tableau to do the exact tasks they’ll need to do every day.
This hands-on training especially prepares them to know what to do when their data isn’t perfect. In the real world, your data is never perfectly clean and that will trip employees up if they don’t know what to do. We equip them to know what to do even when something goes wrong so that they can get back to using their data quickly and avoid less-than-accurate findings.
Focus on data literacy.
A key part of Tableau training is improving data literacy. When we train on Tableau, we teach employees not only how to make visualizations, but how to read them and decide what type of visualization is the best to create in the first place.
In order to glean insights from visualizations, employees must know what data sources should be included, what type of visualization is best, and how manipulating a visualization might give them the different perspective they need to learn something new from their data. Increasing data literacy is what unlocks the potential for unique solutions and insights.
Not every employee has to become a data analyst, so tailor your training to the appropriate Tableau Education Role to avoid information overload.
Help should be readily available.
When you set up your Tableau project team, designate expert leaders that will become a go-to resource for employees that have questions. Then, during training, clearly indicate who these people are and that they should be contacted when your employees reach a roadblock.
After training, make sure those people are extremely accessible and available to answer questions quickly so that your employees don't give up trying to use Tableau early on.
Use Tableau’s online resources.
Tableau has an immense library of training resources as well as an active online learning community. Make every resource available to your employees so they can troubleshoot, learn, and explore Tableau on their own. Even more, Tableau’s conferences are power-packed opportunities for increasing your employees’ understanding of the immense value of data.
Lastly, don’t forget to talk about your “why”.
You have a vision for your company. And you have a reason for going through the Tableau installation in the first place. You probably at this point have spent hours developing an analytics strategy in order to move your business forward in a very specific way. Don’t forget to share that. Create excitement around your “why”.
Where is Tableau taking you as a company? Why is it important to keep using it? What specific goal are you all working toward?
Share that goal, keep sharing it, and when you accomplish it, celebrate it with your employees to show how data got you there. Don’t get lost in the numbers- people get excited about data when they have a clear vision for why they’re using it.
Measurement
Measurement is where you see if you’re getting the most out of your Tableau installation. Are people using it? Are visualizations being shared? Who is using it? How often? And for what purpose? Are you getting the results you hoped for from Tableau?
In the measurement stage you’ll know how often people are using Tableau and what for. One key measurement is how many times certain visualizations are viewed and by whom. Ultimately what measurements are necessary will be determined by your business’ goals for Tableau. If you determined your KPIs while developing your analytics strategy, this is where you find out if you’re meeting them. Set those goals early, even before training begins, in order to tell if adoption is taking place.
Some examples of such goals might be to have a certain number of users trained by a certain date or to have an important workbook used regularly by more than 50% of your team. Only you know your business’ goals, and therefore you know what KPIs will be the most useful to measure. Talk about these early on with your project team, and assign someone who is specifically responsible for following up on them. Without measurement, you can’t be sure you’ve maximized your investment in Tableau.
Beyond ensuring that you’re meeting your goals for adoption, measurement will allow you to continually optimize your environment so that it remains a trusted, regularly used resource. Identify potential problems by tracking metrics like how long workbooks are taking to load, if large workbooks are taking up too much space but not being used, or if extract time is lengthier than expected. Regularly reviewing these metrics and more will help you optimize your Tableau Server for maximum efficiency and reliability.
Analytics best practices
Lastly, for Tableau to be a trusted resource that benefits your business for the long-term, you have to set parameters for the discovery, interpretation, and presentation of your company’s data. Parameters might include when to delete old workbooks, who is allowed to access or input certain data, how to organize and share visualizations, or guidelines for what visualizations should look like when presented internally and to clients.
Your best practices should be determined ahead of time by your project team, communicated during training, updated regularly, and easily available for reference by your employees.
Include these four key explanations in your best practices in order to make them a valuable resource for employees:
Explain the benefits of visual analytics.
Users should fully understand the benefit of producing a graph rather than a spreadsheet full of numbers like your company might have used previously. Remember, you have most likely been learning about the benefits of visualizations for much longer than your average employee has. Don’t expect them to jump on board and add learning Tableau to their responsibilities without communicating its value and importance. We love using Tableau’s article “Why Visual Analytics?” to help explain this value.
Explain the cyclical flow of analysis.
Analysis usually starts with a question. That question leads to a data source, but the exploration of that data leads to more questions and more data. Those new questions and sources may then change what type of visualization is needed to communicate findings. Your users should understand all these steps of analysis and know that it’s not a linear process- they might cycle through each step several times until they arrive at an effective visualization. Knowing this will prepare them to maybe discover more questions and as a result, different insights than they expected. This is where users are truly equipped to explore everything that Tableau can do without getting frustrated that it isn’t a step-by-step process.
Explain how to create effective visualizations.
Don’t throw your users in without explaining visualization basics. What type of graph is the best to use for what situation? What type of visualization is best for the audience you’re presenting it to? Have you added enough context around your visualization to make it easy to understand (i.e. a title, captions, units, commentary, etc.)? All these guidelines will result in experienced, confident users and ultimately in useful visualizations.
Explain any organization-specific guidelines.
Show your employees what a great visualization looks like by setting them up with visual guidelines and even pre-determined templates that match your company’s branding. Adoption of Tableau can most certainly be hindered by messy workbooks that don’t look polished or like they fit your company’s branding and vision. By equipping employees with templates in Tableau, you help them create visualizations that they’re proud to present both internally and externally.
These best practices will ensure that you protect your investment by keeping Tableau a trusted, regulated resource, while setting up your employees to create effective, sleek visualizations that benefit your company’s reputation and goals. Revisit your best practices regularly, keep them updated, and keep talking about them and sharing them with each update.
Harness the power of your data.
CSG would love to help your employees get the most out of Tableau.