There is undoubtedly more data available for business use than ever before. In 2020 every person generated 1.7 megabytes of data per second, and internet users create about 2.5 quintillion bytes of data per day. But having data and having insight are two very different things. Unless businesses actually use the data, there’s no reason to boast in the amount of available data in the world or at your company. It’s like saying that you own a lot of golf clubs but not knowing how to swing one. Having data does nothing for a business unless they know how to put their data to use and utilize data to improve their business processes and products. That’s where data analysis comes in.
55% of data collected by companies sits unused. This data has been collected and processed but not harnessed for decision-making or any other use. If your company is going to pay to gather and store data, it’s essential to have data analysis processes and personnel in place so that the data you’re storing can start making or saving you more money.
Insight gained from data analysis can help trim the fat off business processes and spending, make products and services better, and keep your company one step ahead of competitors. Read on for a useful intro to data analysis - the process that can help you start turning your data into insight and can translate that insight to increased profits for your company. Key questions and topics we’ll be covering include:
- What data analysis is
- The difference between “data analysis” and “data analytics”
- The two types of data
- The most common data analysis methods
- Examples of how companies use those methods every day to make better decisions
What is data analysis?
Data analysis is the process of cleaning, analyzing, and interpreting data to inform decision-making and discover competitive advantages for your business. This includes using traditional statistical methods, AI, machine learning, natural language processing, and more to gain insight from your data. Companies use data analysis to gain a better understanding of their internal processes, products, customers, the market, and competitors. Think of data analysis like an extremely effective life coach in that it helps businesses gain a deep understanding of where they have been, how they arrived at different successes and failures, and how to select the best course forward. (Except data analysis might be more like a fortune teller- because it can actually help your company predict the future.)
What is the difference between data analysis and data analytics?
It might seem like semantics, but there is a difference between the phrases “data analysis” and “data analytics.” Data analysis is just one important step in a company’s overall data analytics strategy. The term “data analytics” accounts for all ways that a company handles and manages their data - not just how it is analyzed. Data analytics includes how data is stored, governed, organized, then analyzed, as well as all of the tools, techniques, and strategies involved in those efforts. Although analysis is a core focus of every effective data analytics strategy, it is just a part of a company’s data management efforts.
The two types of data
There are two types of data that organizations access for data analysis: qualitative and quantitative data.
Quantitative data is data that is structured and measurable. It’s what most people assume when they hear the word “data”. Quantitative data can be easily verified and tested using mathematical techniques, and it usually answers questions like “How many?”, “How often?”, “How Much?”, or “What percent?”. For business this data usually includes metrics like quarterly sales, the number of customers of a certain age in the region, or how many times an item or page was clicked on your website.
Qualitative data on the other hand is data that is unstructured and can’t be easily quantified or measured. It usually answers questions of observation such as “Who?”, “What did they say?”, “How do they feel?”, or “What did it look like?”. Qualitative data could include data from text, speech, images, videos, etc. Common sources of qualitative data are emails from your customers, social media interactions, report tickets for customer issues, chatbot conversations, product reviews, surveys, customer service calls, and more. With such a variety of sources, the amount of qualitative data available to your company is almost limitless.
Quantitative data has traditionally been the easiest to organize and categorize, as it includes specific metrics, whereas qualitative data is harder to manage. 95% of businesses cite that managing unstructured data is a challenge for their business. With the implementation and improvement of Artificial Intelligence and natural language processing, companies can harness more and more of their unstructured, qualitative data for decision-making. Thankfully these technologies are only improving to meet the demand: the natural language processing market is expected to grow to $26.4 billion by 2024 - more than double its current value.
By combining these two types of data, companies can create a full understanding of customer opinion and learn how that translates to performance.
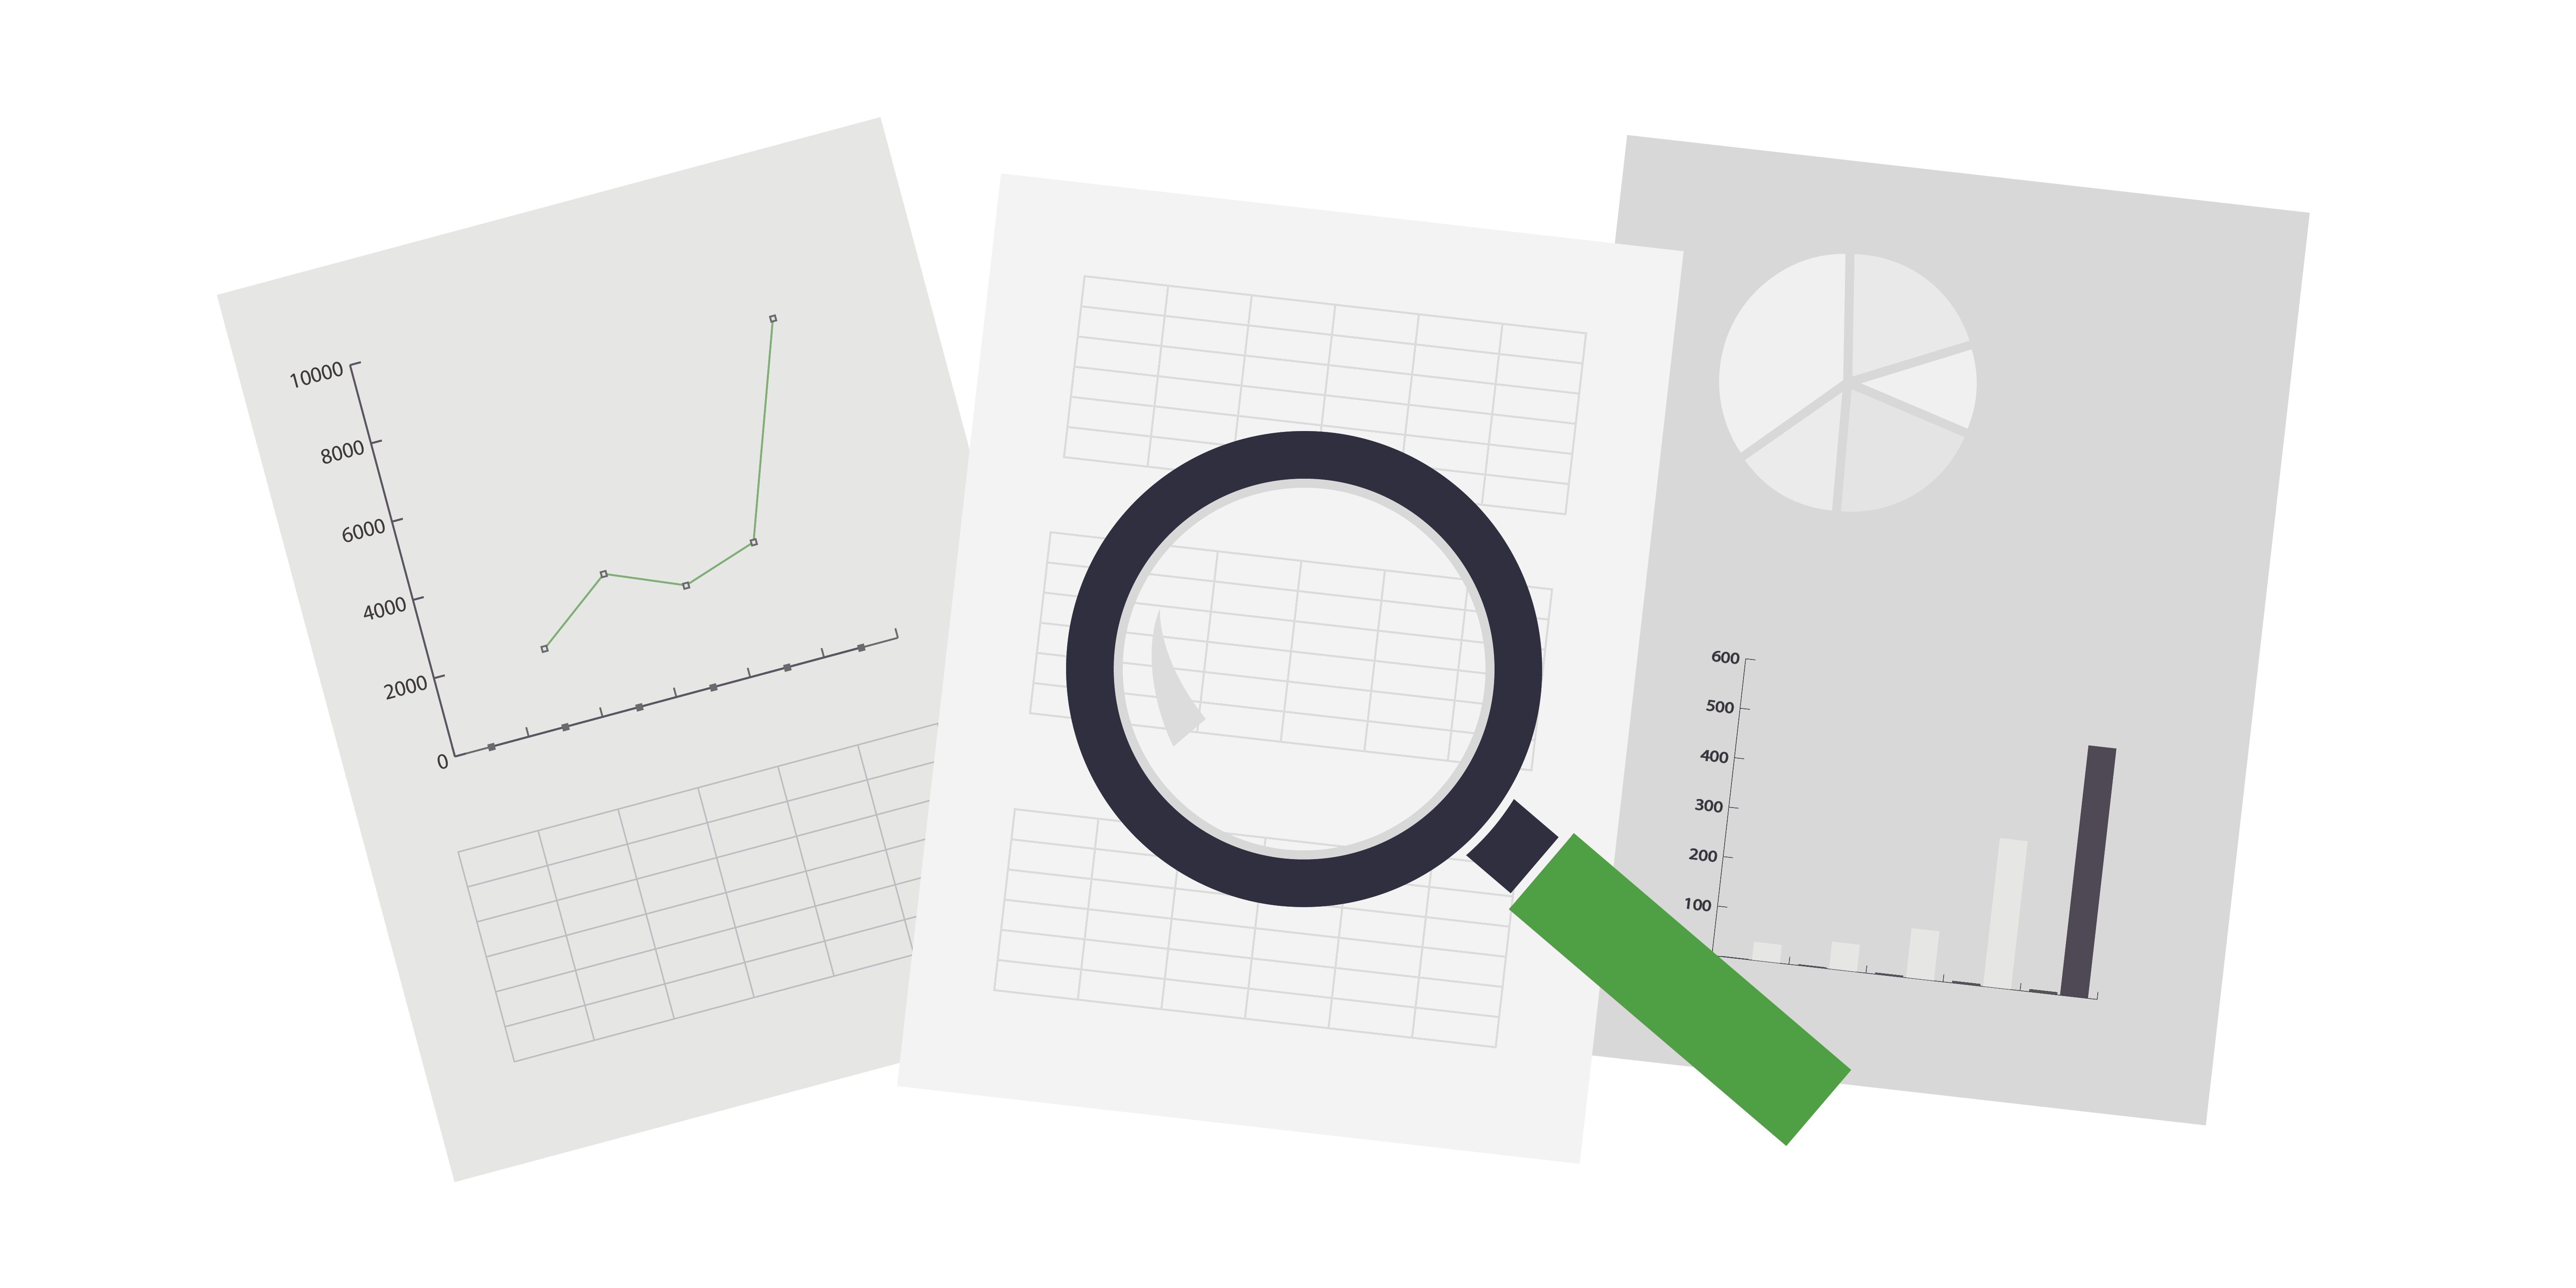
Data analysis methods
Data can tell all, but different methods unlock different insights for your business. The most commonly used data analysis methods are: descriptive, diagnostic, predictive, prescriptive, and text analysis. Each can be used to either give clarity to past performance or to help you chart important next steps for your business.
Descriptive Analysis
Descriptive analysis is the most common data analysis method and is the foundation for all other types. Descriptive analysis answers “What happened?” and includes data on a company’s key performance indicators (KPIs) such as sales figures, expense records, losses, and more.
Performing descriptive analysis through data visualization can expose important trends and patterns in a company’s data to help them better understand their customers, processes, products, and market. Descriptive analysis could help a grocery store compare quarterly sales across different regions. It could help a logistics company assess a delivery timeline to understand areas of inefficiency. Or it could show a marketing company where the largest concentration of their client’s target customer resides.
Descriptive analysis is the simplest data analysis method, but is the backbone of any data-driven company’s decisions. When you equip employees with the tools and training to support their daily responsibilities with descriptive analysis, you set a foundation for accurate, lower-risk decision-making all across your company.
Diagnostic Analysis
Descriptive analysis will never answer why something happened but only what happened. Diagnostic analysis answers the why. It looks for causation, influences and motive, often by identifying patterns or deviations in the data. Diagnostic analysis might compare the fact that there was an increase in sales at a pharmacy in a region where a competitor recently went out of business. It could correlate product reviews and customer service calls to discover that a product was regularly returned at a loss because customers were dissatisfied with its quality.
Diagnostic analysis is essential to getting business value from your descriptive analysis insights and to creating lasting change in your organization. Once diagnostic analysis tells you the why behind the success of any initiative or product, you can then create repeatable processes to retain customers and continue performing the actions that lead to success.
Predictive Analysis
Predictive analysis uses trends from historical data and projects those trends into the future, oftentimes incorporating the effects of additional variables. Predictive analysis is especially useful when pitching new initiatives or changes to investors and leadership. For example, a company could use it to present the case for opening an office in a new city by projecting their estimated sales for their first three years of business in that city. They could create accurate projections for investors by combining data on the potential clients in that area, the size of projects they are likely to get, and information on current sales. (For an example of this, read our case study on how one utility company used data to strengthen their pitch to venture capitalist investors.)
This type of analysis can also be used to predict actions of customers. For example, companies could use information on a new competitors’ sales, store locations, and target customers to predict how many customers they risk losing to the competitor. Predictive data analysis is crucial to helping companies make better decisions, examine complex variables, and proactively mitigate future risk.
Prescriptive Analysis
Prescriptive data analysis answers the important question of “What will happen if…”. This type of analysis is the most complicated of all the data analysis methods, yet perhaps the most useful for companies trying to outpace competition and safeguard their decisions and progress.
Prescriptive analysis helps companies understand the probable effects of specific actions in order to select the best option with greater certainty. It utilizes data science models and often machine learning in order to take all variables into account and analyze complex data sets.
This type of analysis could help a logistics company identify where to add a new route to decrease transport time. It could help a company compare which competitor they should purchase in an effort to expand into a new market and overtake a new customer base. Or it could help a lender approve or reject applicants by calculating their level of risk. Prescriptive analytics is most useful for industries with intricate processes, where there are so many variables that the risk of making the incorrect decision would come with unforgiveable costs. Prescriptive analytics helps you clarify all possible outcomes before making weighty decisions with your company’s future.
Text Analysis
Text data analysis or text mining involves the analysis of qualitative data through the use of natural language processing or machine learning. Text analysis can tell a company about the quality of their customer relationships, customer satisfaction, frequently asked questions, or common problems.
With text analysis companies gain important insight from their unstructured data. This is crucial considering about 80-90% of a company’s data is unstructured. That’s a lot of information left unused if not harnessed through text analysis. Without text data analysis, resolving issues would be left up to individual account representatives or customer service representatives, making it nearly impossible for those in leadership to get an accurate, high-level understanding of the overall customer experience.
Using natural language processing, a company could search unstructured data from complaint tickets or product reviews and analyze which product or store the customer complains about the most. It could help a company regularly view the sentiment rating of all of their social media followers to understand what feelings their customers express publicly about their product. Text data analysis is a powerful tool for understanding how to better connect with your customer or client or improve your products and services to meet their precise needs.
Using all types of data analysis, businesses can have an eagle eye view of every aspect of their company and assess inefficiencies and risk at every turn. Instead of constantly reacting to the market or customer dissatisfaction, companies can use data analysis to get ahead of the curve, find out what customers want, and test new products and markets before competitors. You can launch new initiatives with greater assurance of success, and if difficulties arise be equipped to know the exact reason for those inefficiencies and problems.
Companies that focus on using data to their advantage and making data-driven decisions experience 25% faster innovation cycles and a 17% increase in business efficiencies. Netflix saved $1 billion per year by implementing an effective data strategy to solve issues related to customer retention and subscription cancellation. One of our clients in the healthcare industry set themselves up to save $50 million per year by optimizing their supply chain using big data.
Collecting data doesn’t automatically create organizational and financial improvement, but data analysis paired with an effective data strategy certainly does. Data can help solve some of your company’s most costly problems if you are committed to allocating talent and resources toward effective data analysis.
Looking to turn your data into actionable insight? CSG can help.
Read our article about developing a proactive data analytics strategy with Tableau: